20
Feb
Solving the patent quality vs. quantity conundrum–Demystifying cellular patents and licensing–Part 6

As I discussed in my previous articles, the industry is finally waking up to the fact that when it comes to patents, quality indeed matters much more than quantity. Also, the realization that simpleton approaches such as standards contribution counting or counting the mere number of patents doesn’t give an actual picture of technology leadership. At the same time, assessing the quality of patents has been a challenge. While the gold standard, in my view, is market-based valuation, new quality accessing metrics and methods are emerging. These are designed to consider many aspects such as how fundamental and market-impacting the inventions are, how wide the reach of the patents is, how many other patents are derived from them etc. and try to come up with a quality score. I will explore many of them as part of this article series, here is the discussion on the first one on the list.
<<Side note: You can read the previous articles in the series here. >>
Patent Asset Index™ by LexisNexis® Patent Sight®
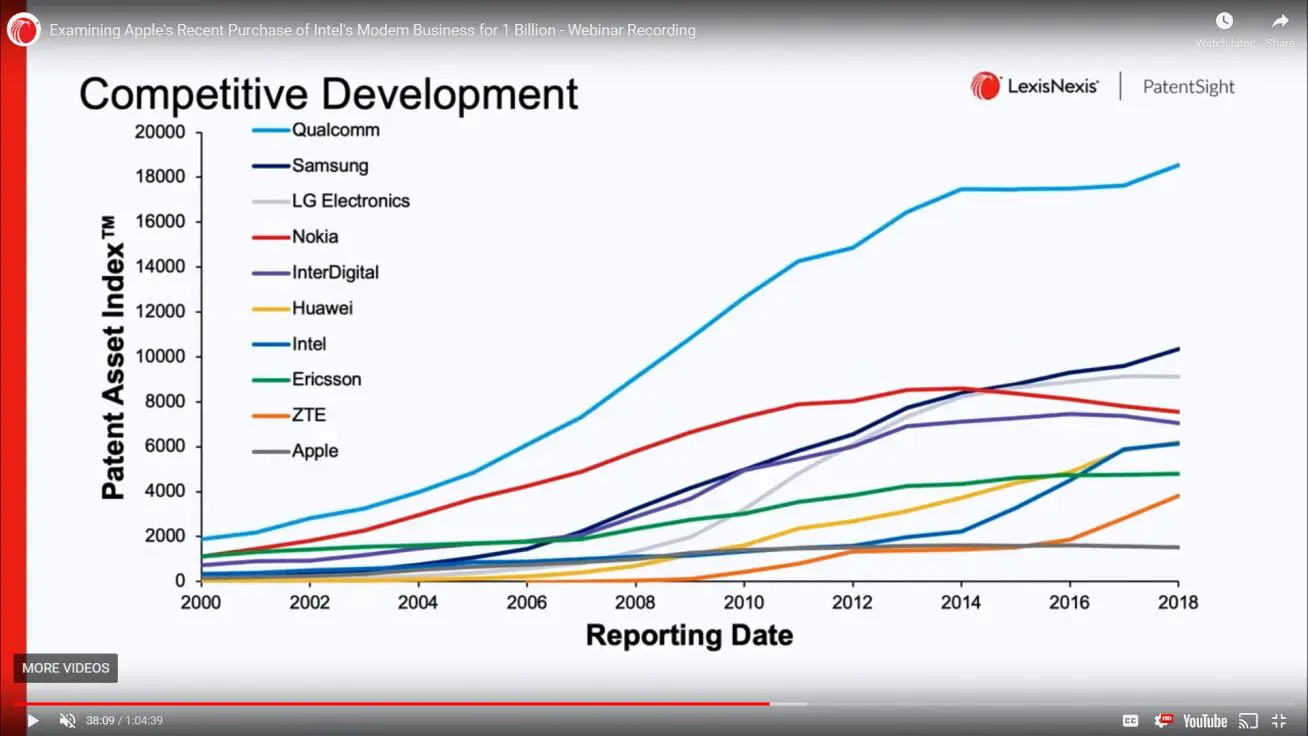
Patent Sight is a leading patent analytics and valuation firm, based in Germany. Its services are utilized by many leading institutions in the world, including the European Commission. Patent Sight has developed a unique methodology that considers the importance of the patent in the hierarchy of the technologies, its geographical coverage, and other parameters to provide a score called the Patent Asset Index. This index allows industry as well as general audiences to not only understand the comparative value of the patents that various companies hold but also rank them in terms of technology leadership.
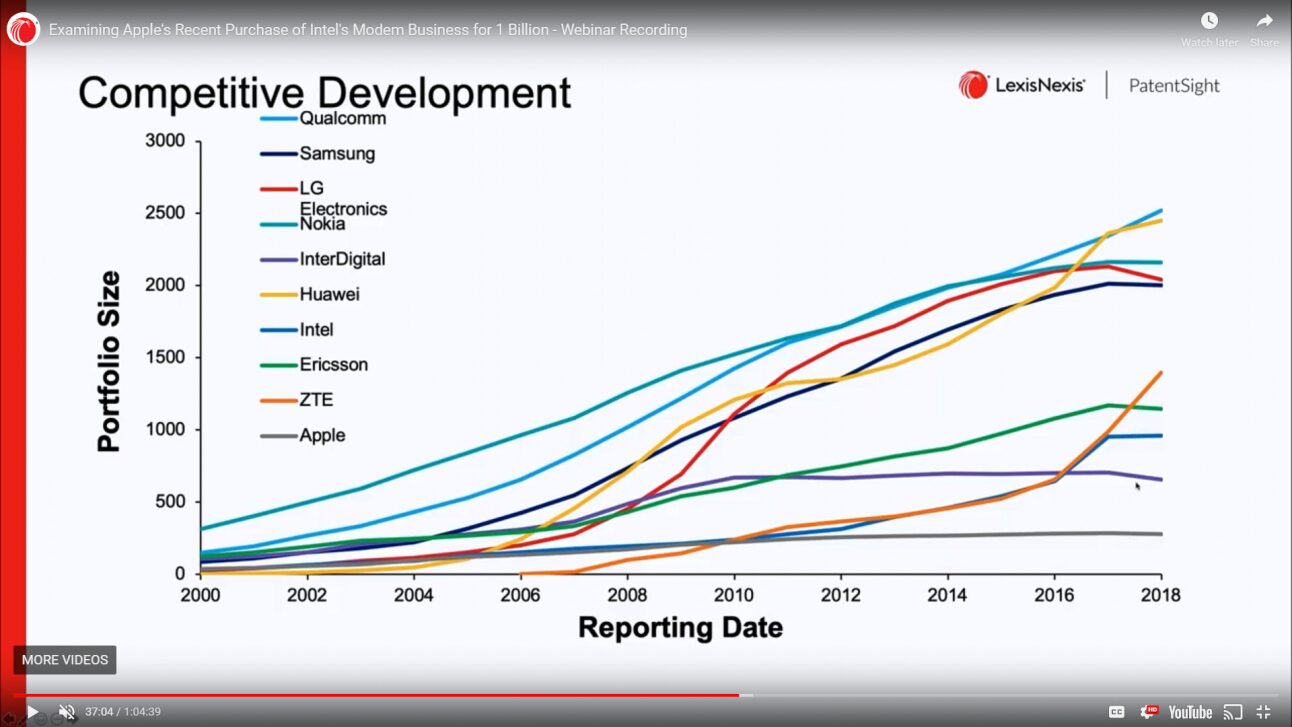
Here are some of the Patent Sight charts regarding 4G and 5G patents, presented at a recent webinar hosted by Gene Quinn of IPWatchDog. During the webinar, William Mansfield of Patent Sight shared these charts. The first chart shows the number of patents filed by some of the top cellular companies between 2000 and 2018. As is evident, if only quantity was the metric, one could say that companies such as Qualcomm, Huawei, Nokia, LG, and Samsung, are far ahead of the others.

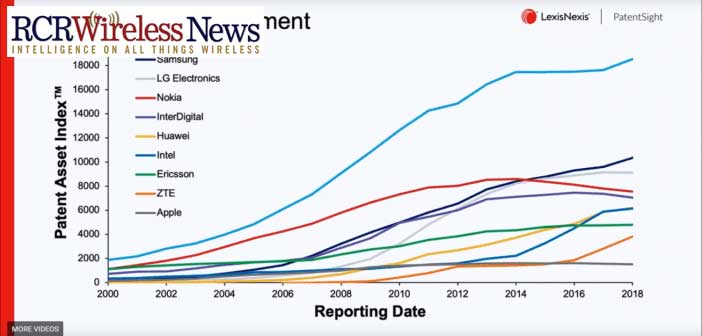
Now let’s look at the Patent Asset index chart of the same companies:

